Home → Air Quality → Air Quality Forecast → Air Quality Trends
Air Quality Trends
Maine DEP staff analyzes data gathered at our various monitoring sites. There are many different things one can learn when analyzing data. One important part of air pollution data analyses is information about trends. Maine DEP staff are interested in various trends such as:
- Daily – Ozone levels are higher during the afternoon and evening. Normally, particle pollution levels tend to be higher in the morning and evening but higher levels due to wildfire smoke can occur at any hour of the day.
- Annual – Ozone can reach levels of concern from late March through mid-October while particle pollution can reach levels of concern during the summer and winter months.
- Historical – Pollution levels have been dropping from what they were 25 years ago.
Maine DEP is interested in trends for many reasons. They include helping to decide where to deploy monitors and knowing the effectiveness of national and state pollution control legislation. For this purpose, it is important to know the past and current design values for pollutants of concern.
Design Value
Ozone
The design value is what the Environmental Protection Agency (EPA) and Maine DEP use to determine whether an area is attaining (meeting) the National Ambient Air Quality Standard (NAAQS) for ozone. An explanation of how the design value is calculated can be found below the graph. This graph clearly demonstrates that ozone levels in Maine have been dropping over the last 30 years. The ozone trend shows some variability from one year to the next yet overall, the trend has been downward. As each new, lower standard has been enacted, Maine’s ozone values nearly always averaged below the standard. The only exception is 2017 for that year’s design value alone was above the standard set in 2015. Values dropped further the following year and remained below the newest standard for all subsequent years. Since ozone is transported in from other areas, Maine's ozone levels drop when national and regional air quality controls are implemented.
The current ozone NAAQS is an 8-hour average of 70 parts per billion (ppb).

The design value for each monitoring site is the average of the fourth highest maximum daily 8-hour ozone concentration for each of three consecutive years as long as data recovery rates meet requirements. The design value for a site can be determined (is valid) if the monitor meets data completeness requirements. The site must have valid data for at least 75% of the days in the official ozone season (April through September) for each year and a three-year data collection rate of at least 90% unless the three-year average exceeds the NAAQS. The graph above displays the maximum design value trend in the state.
Particle pollution
There are two design values for particle pollution.
- The (short-term) 24-hour design value is the three-year average of the 98th percentile 24-hour concentration for each of the years. The yearly 98th percentile 24-hour concentration is determined by taking all the monitored 24-hour concentrations for the year, ordering them from greatest to least, determining the 98th percentile position (the position equal to or greater than 98% of the data) and using the particle pollution 24-hour concentration at that position for that year. For example: if 50-99 valid 24-hour concentrations exist during the calendar year the 2nd highest concentration is the 98th percentile concentration and if 100-149 valid 24-hour concentrations exist during the calendar year the 3rd highest value is the 98th percentile 24-hour concentration.
- The annual design value is the three-year average of the annual average. The annual average is determined by first calculating the average 24-hour concentration for each quarter of a year and then calculating the average of the four quarters for that year.
The design value for a site is valid if the monitor meets data completeness requirements. The site must have valid data for at least 75% of the scheduled sampling days for each quarter unless the quarterly average, or the 98th percentile 24-hour concentration, exceeds the NAAQS.
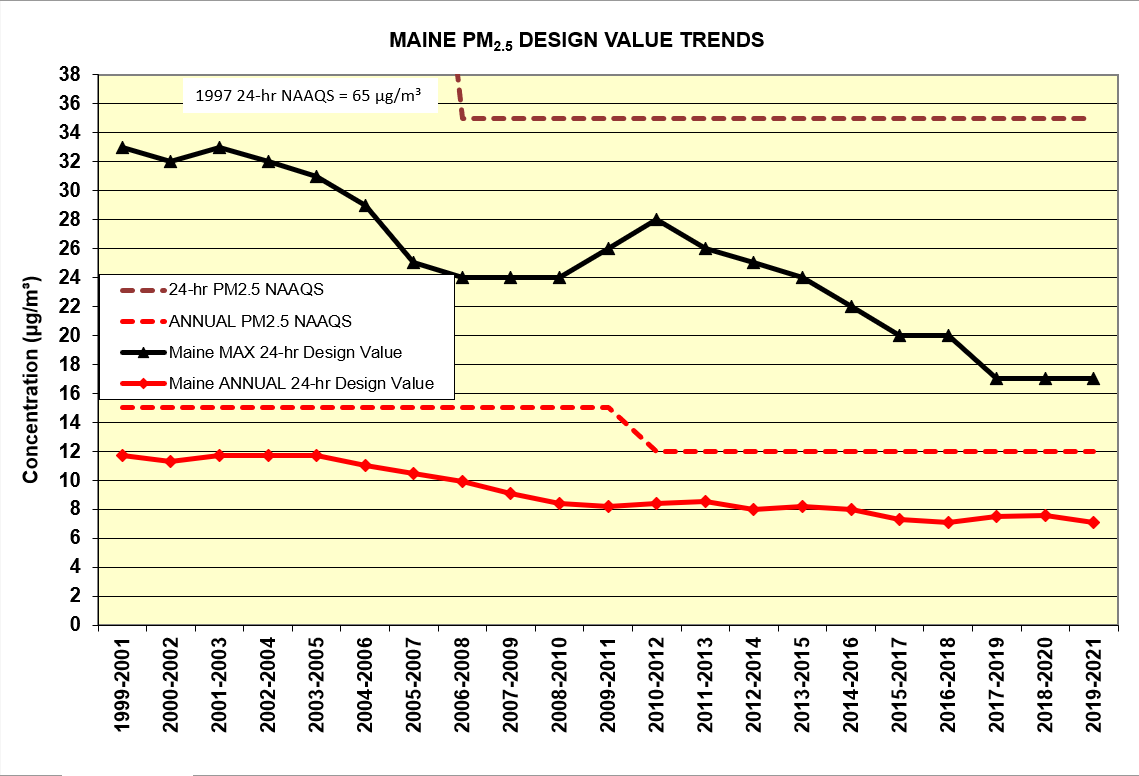
In the graph below, the 24-hour and the annual design values for the state are plotted. Maine has always been in attainment of the fine particulate matter (PM2.5) NAAQS. Both the annual and 24-hour average design values have remained below the NAAQS even when that standard has been reduced. The annual design value shows some interannual variation but overall, there is a slow downward trend. The 24-hour design value shows more variability yet still an overall downward trend through 2022. In recent years, smoke from wildfires was brought to Maine multiple times each year which contributed to increases in the 24-hour design value.
If you would like to know more about daily, regional and annual trends contact us.