Home → For Libraries → Statistics - 2011
Maine Public Library Statistics - FY 2012
 Did you know...
You can calculate the Return on Investment (ROI) using the Library Use Value Calculator and your annual report statistics?
Need help gathering statistics? Try a statistics worksheet.
The information in this report is designed to help librarians and trustees assess how well their libraries are performing, identify areas for improvement and make long range plans. If you have any questions about the annual report statistics, contact Jenny Melvin, the State Data Coordinator at 207 947-8336, extension 116.
Tips for using the numbers:
- Show how the use of the library goes up over time
- Compare and contrast your library to nearby libraries or other libraries of the same size
- Combine census information and library statistical data in grant applications
- Illustrate the effectiveness of library services and programs
- Inform decision makers and your community about the value of the library
- Advocate for budget or staff increases
- See also Does Your Library Count? - Importance of the statistics, how to compare libraries, how the State Library uses the statistics
Use of the Value Calculator illustrates the Return on Investment (ROI) that an individual library returns to its community (How to calculate the ROI).
FY2012 Data
Documents below and in the sidebar are provided in PDF or Excel formats. To view PDF documents, you will need the free Adobe Reader. To view Excel files you will need either Microsoft Excel or the Excel Viewer. If you need assistance, view our PDF Help page or contact us at (207) 287-5620.
Using Maine Public Library Statistics Tables
- Bibliostat Workbook 2012 [Excel, 1.07mb, best saved to your computer by a right click then opened]
The raw data, collected through the 2012 Annual Report for Maine Public Libraries, is available to analyze in one Excel workbook with mulitple worksheets and may not always print well, depending on your printer. Best used electronically and print report above or pdf files below instead. Please note that the salary information is on a separate tab - last tab-- olive green, after the state data.
If you need different queries than what is listed below, contact Stephanie Zurinski via the Contact Us page, using the drop down menu for her name.
 How to Print workbooks
- Bibliostat workbook tabs: Colored tabs at the bottom of spreadsheets provide access to the different data sections.

- By Population: Selected Data and Per Capita Figures
Data from the full workbook, selected per capita computations, and financial and services summaries. The bottom tabs provide links to the various data sections. How to Print
 - Under 1,000 [xlsx, 31kb]
- 1,000-2,499 [xlsx, 46kb]
- 2,500-4,999 [xlsx, 38kb]
- 5,000-9,999 [xlsx, 38kb]
- 10,000-24,999 [xlsx, 28kb]
- Over 24,999 [xlsx, 23kb]
- Summaries [xlsx, 14kb]
- Position-Salary [xlsx, 36kb]
- Under 1,000 [PDF, 137kb]
- 1,000-2,499 [PDF, 220kb]
- 2,500-4,999 [PDF, 176kb]
- 5,000-9,999 [PDF, 171kb]
- 10,000-24,999 [PDF, 224kb]
- Over 24,999 [PDF, 79kb]
- Summaries [PDF, 66kb]
- Position-Salary [PDF, 235kb]
In Excel (xlsx)
As PDF files
Copy of Survey and Definitions for 2012
- 2012 survey for annual report, [Word,33 KB]
- Instructions & definitions [Word,35 kb]
To Print a Workbook
... Bibliostat workbook data
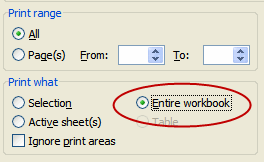
Choose Print > In the Print dialog box be sure to select "Entire Workbook" under "Print What."

Quick Access
- Past Statistics
- Public Library Directories
- National Search for Public Libraries
- Institute of Museums and Library Services (IMLS)
