DACF Home → Bureaus & Programs → Maine Geological Survey → Maps, Publications and Online Data → Using Geologic Maps → Reading Surficial Materials Maps
Reading Surficial Materials Maps
What's on the maps?
A surficial materials map shows the textures of surficial sediments, independent of interpretations regarding their origin. Thicknesses of gravel, sand, silt, clay, and diamicton are shown. Data comes from natural exposures such as stream or river banks, gullies, slumps, and scarp faces, as well as construction sites and foundation excavations, auger holes, test pits, well logs, test borings, and gravel pits.
Uses of the maps
The data shown on surficial materials may be used for a variety of purposes by landowners, planners, teachers, or anyone else wanting to know what lies beneath the land surface.
- For example, it may aid in the search for economically important deposits such as sand and gravel for aggregate or clay for bricks or pottery.
- Environmental issues such as the location of a suitable landfill site or the possible spread of contaminants are directly related to surficial materials information.
- Construction projects such as locating new roads, excavating foundations and utility lines, or siting new homes are also important uses of materials data.
Definitions
What are surficial materials?
Geologic processes such as weathering and erosion break bedrock down into smaller particles of sediment. Sediments such as clay, silt, sand, gravel, and other loose deposits which lie on top of bedrock are grouped together in the general category of "surficial materials." These materials are not soils; they are the deeper earth materials that lie between the soil zone and the underlying bedrock. Soils commonly develop by weathering of the uppermost part of these materials.
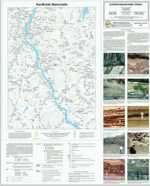
For a more detailed definition of the classification of surficial materials, read the map explanation (pdf). For photos of different types of surficial materials, view the map sidebar (pdf)
Tips for Reading the Maps - Map Symbols
Why are the symbols concentrated in some areas and very sparse in others?
Figure 1 shows a typical distribution pattern of data points on a surficial materials map. Data collection is often concentrated along roads, near construction sites, and along stream banks and other natural exposures. Due to time constraints in the mapping process, inaccessible areas are not often investigated in detail, creating data "gaps" on the map. In these areas, topographic maps and air photos are used to interpret the underlying geology.

Figure 1. Typical distribution pattern of data points on a surficial materials map. Data collection is often concentrated along roads, near construction sites, and along stream banks and other natural exposures.
What is the accuracy of the map symbols?
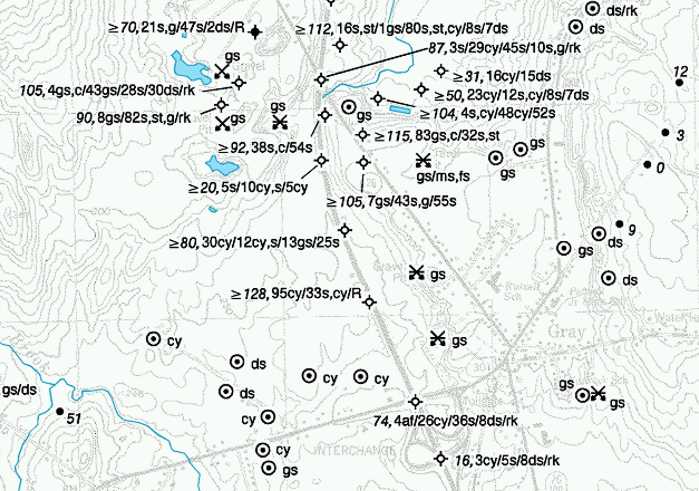
Subsurface records from observation wells and test borings provide the most detailed information shown on the materials maps (Figure 2). At the other extreme, observations at shovel or hand-auger holes only show the type of material at a shallow depth from the land surface. Deposits which may occur under this surface layer are not known. The map user should be aware of this distinction when interpreting the data shown on the map.

Figure 2. Subsurface records from observation wells and test borings are shown as lengthy strings of letters in the figure (refer to Figure 3 for more information). Auger holes are shown by a dot in a circle in the figure, and the material is shown by an abbreviation -- cy for clay for instance.
How do I read the abbreviated logs of wells and test borings shown on the map?
Abbreviations used in the well logs are shown on the map explanation (pdf). See Figure 3 for examples of how to read sample well logs.
Figure 3. Subsurface records from observation wells and test borings provide the most detailed information shown on the materials maps. The following examples show how to read the abbreviated logs:

minimum depth to bedrock is 112 feet (the test boring did not reach bedrock); starting at the surface, the surficial materials at this point consist of 16 feet of sand and silt over 1 foot of gravelly sand over 80 feet of sand, silt, and clay over 8 feet of sand over 7 feet of sandy-matrix diamicton

depth to bedrock is 87 feet (the test boring reached bedrock); starting at the surface, the surficial materials at this point consist of 3 feet of sand over 29 feet of clay over 45 feet of sand over 10 feet of sand and gravel over rock
What are the red dots and numbers?
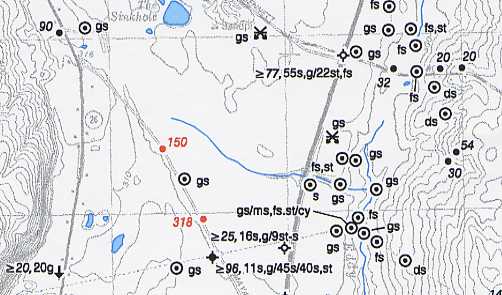
Geologists perform seismic refraction surveys to gather subsurface information for the Significant Sand and Gravel Aquifers Program. Interpretation of these profiles gives depth to bedrock and depth to the water table. The red dots and numbers are the bedrock depths resulting from these surveys (Figure 4). Depth to water at these points is given on the significant aquifer maps. For a more detailed discussion, read Seismic refraction profiling: An important tool used in mapping sand and gravel aquifers.

Figure 4. Geologists perform seismic refraction surveys to gather subsurface information for the Significant Sand and Gravel Aquifers Program. Interpretation of these profiles gives depth to bedrock and depth to the water table. The red dots and numbers are the bedrock depths resulting from these surveys.
What is the relation between the point data shown on the materials maps and that shown on the significant aquifers maps?
Surficial materials maps do not show any information related to depth to water. All water-related information is shown on Significant Sand and Gravel Aquifer maps.
Tips for Reading the Maps - Related Maps
How does the surficial materials map relate to a surficial geology map?
Surficial materials maps show the actual field observations on which the surficial geology map is based. The geologist uses this information, in addition to air photos, topographic maps, soils maps, and wetlands maps to compile the geologic map. The materials map shows just the materials, whereas the geologic map interprets the geologic history and origin of the materials.
How does the surficial materials map relate to a significant aquifers map?
Geologists use the information on both surficial materials and surficial geology maps when mapping significant aquifers. These maps provide information which locates deposits of sand and gravel which are potential aquifers.
More Information
For more information on Maine's surficial materials, refer to the following pages:
For further assistance in interpreting this map, contact a geologist at the Maine Geological Survey.
Last updated on January 20, 2011
